Prerequisite Modules
- Development Software Suite
- Version Control
- Embedded C and IAR Primer
- Firmware System
- LED Basic
- Button Interface
Getting data in and out of an embedded system is important. Sending data out to a computer is very useful for status, debugging, and datalogging; taking information in from a keyboard or file is a great way to attach a much more powerful interface to the embedded system and can be used to control the system or send configuration data.
The RS-232 serial port was once very common on PCs and lives on through USB-to-serial adapters. The virtual COM port found on the EiE development boards is an integrated USB-to-serial adapter. The interface is essentially the “standard out” of the embedded world so we can create a “printf” style output function. The stdio function “printf” is actually a very complicated function to implement and since we are limiting our code footprint, the API offers very simple text and numeric output functions. The data stream of characters in and out of serial port is straight forward and simple text-based input/output can be achieved quite easily. Not as easily as blinking LEDs and reading buttons, but it’s the next easiest thing and far superior.
A terminal application like Tera Term is required to interface to the development board to read and write the ASCII character stream. ASCII is the classic 8-bit standard for encoding alphanumeric characters — see https://www.asciitable.com . The more modern encoding scheme is called Unicode which has 16-bit and 32-bit variations.
The RS-232 serial protocol relies on strict timing and framing which both the transmitter and receiver must know before communication can start. The Debug serial interface for EiE uses 115,200bps, 8 data bits, 1 stop bit, no parity, no flow control. The serial port settings of the PC terminal application you use must match these values for the two systems to communicate. This is why you had to adjust the settings in TeraTerm or whatever terminal program you use in order to see the debug output from the development board.
While sending data out from the dev board is fast and easy, reading data in takes some work to properly receive, parse and buffer each character that comes in. Both reading and writing are managed by the “UART” peripheral on the development board which takes care of a lot of the work in generating the output and receiving the input. The Debug driver is responsible for writing data out to the UART peripheral and reading input data that comes in. It monitors the input stream and will respond to certain input strings. A menu of available services will be displayed by typing “en+c00” from a terminal window. This special string is purposely a bit strange and sort of stands for “Engenuics command number.” It is defined this way to (hopefully) avoid the string occurring randomly if there was other data coming in from the terminal.
The debug driver is always watching for the special string. Any other text that is entered and terminated with a carriage return will produce a message “Invalid command” but that does not mean the input is lost. The Debug driver stores characters in a global buffer that can be read with a scanf-style input function so other tasks can access the input even if the Debug task doesn’t recognize a command.
Type Definitions
There are no type definitions unique to this API.
Globals
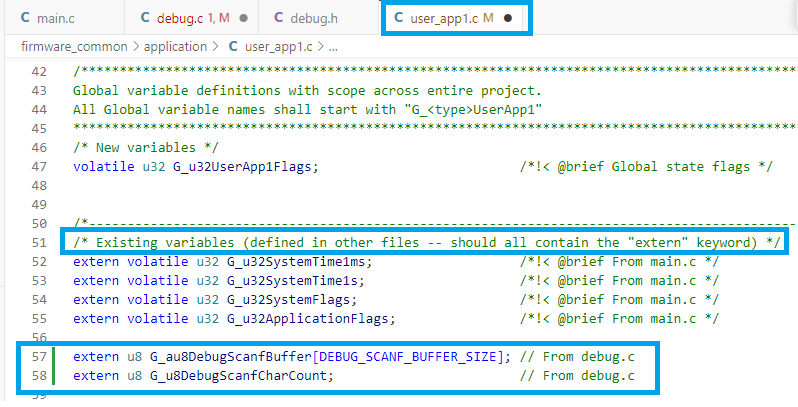
The following Globals may be imported into tasks. This is a REALLY IMPORTANT part of using the Debug application, because if you want a task to read the debug input, these MUST BE ADDED at the top of each task source file that wants to use them.
- G_au8DebugScanfBuffer[] is the DebugScanf() input buffer that can be read directly
- G_u8DebugScanfCharCount holds number of characters in Debug_au8ScanfBuffer
- DEBUG_SCANF_BUFFER_SIZE is the size of G_au8DebugScanfBuffer and thus the max of G_u8DebugScanfCharCount
The code to copy is written at the top of debug.c to make it as easy as possible for you!
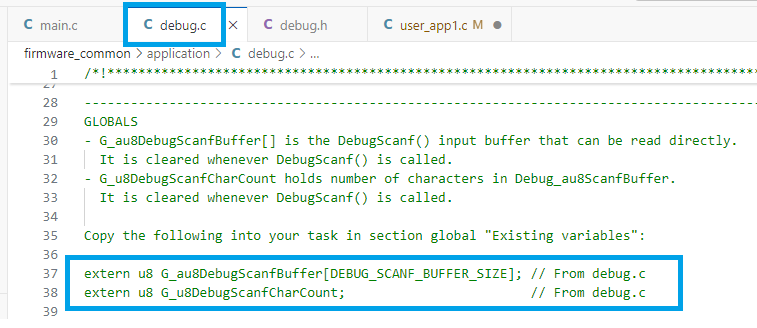
So if you plan to access the input buffer in User App1, copy the above code to the “Existing variables” section at the top of user_app1.c:
Public Functions
The following functions may be used by any application in the system:
- u32 DebugPrintf(u8* u8String_) – Queues the string pointed to by u8String_ to the Debug port. The string must be null-terminated. It may contain control characters like newline (\n) and linefeed (\f).
- void DebugPrintNumber(u32 u32Number_) – Formats a long into an ASCII string and queues to print. Leading zeros are not printed.
- void DebugLineFeed(void) – Queues a sequence to the debug UART.
- u8 DebugScanf(u8* au8Buffer_) – Copies the current input buffer to au8Buffer_ and returns the number of new characters. When DebugScanf is called, the G_au8DebugScanfBuffer buffer is cleared and G_u8DebugScanfCharCount is 0.
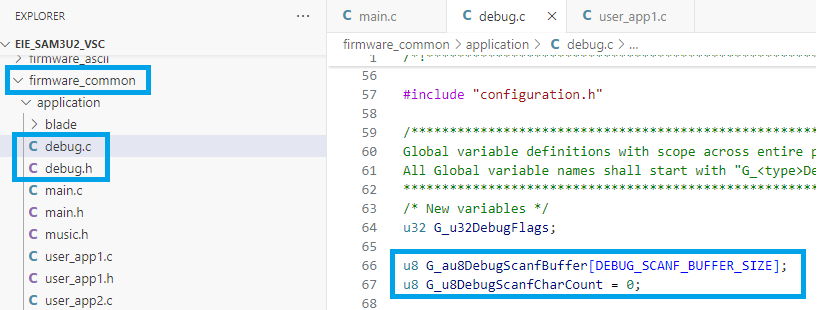
Now is a good time to branch your master branch to a “debug” branch in Git. Open debug.c and debug.h from the firmware_common folder and look at the top of debug.c to notice the two global variables for a buffer and a character count. This becomes important soon!
Practice
Code the following in UserApp1Initialize() and use the debugger to step through and see the results. Use “Step Over” on each function call. Note that because this code is running during Initialization, the EiE firmware will execute the command completely. If you try to step Debug API calls in the main program, nothing will happen because the message is only queued and must have the regular system running to process and send or receive a message.
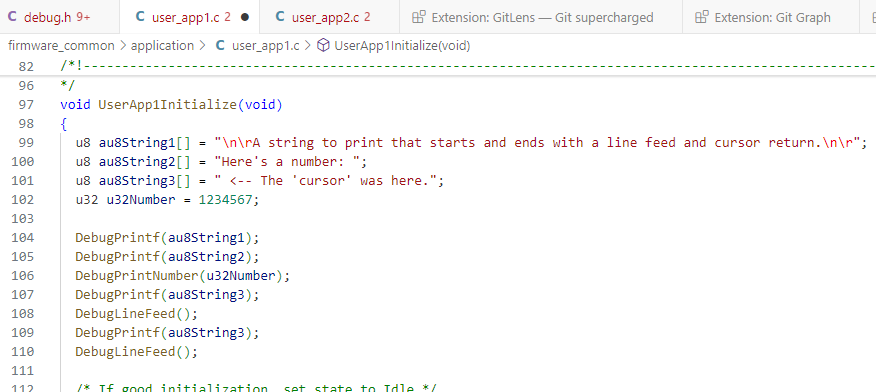
Run the program and observe the terminal output. Try to predict what you will see with each line before you step! If you did not predict it correctly, make sure you understand why – probably the most important step in this module!

Let the program run through to main. Once the main loop is running, enter “en+c00” in the terminal window to display the menu. Activate the LED test by typing “en+c01”. Then try typing the letters RGBRB and see what happens on the dev board as you type. All LEDs should be purple by the end.
Press “ENTER” to clear the entry then type “en+c01” again to toggle the LED test off. You should see “Invalid command” after pressing “ENTER” because the debug driver that processes commands looks at “RGBRB” and does not recognize it as a “en+cxx” command string. A different part of the Debug driver code is reading the character stream to toggle the LEDs. This demonstrates how different tasks or portions of tasks can be looking at the input stream simultaneously.
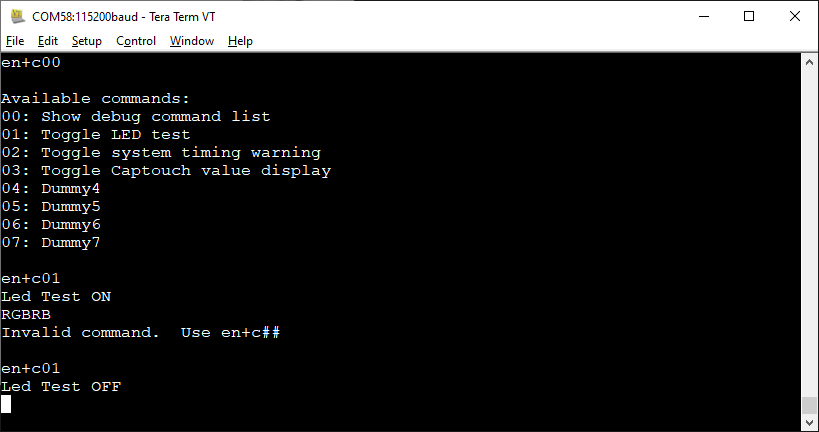
Lastly, try “en+c02” which activates the warning when a 1ms violation occurs.

For the ASCII LCD development board, no warning messages should be printed. For the Dot Matrix board, you will see a periodic warning message IF the captouch driver is running. As of this moment, the hunt for the gcc captouch driver from Atmel is still ongoing, so the code is not running and you should not see any errors.
When you are developing your own tasks, the system timing warning feature is very useful to check if your code is violating the 1ms time rule. To test this, add the following code to UserApp2Idle():
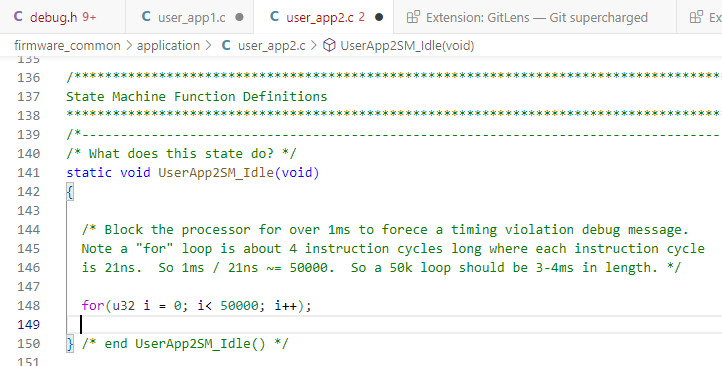
Build and run the code with the en+c02 option enabled – you should see a lot of violations.
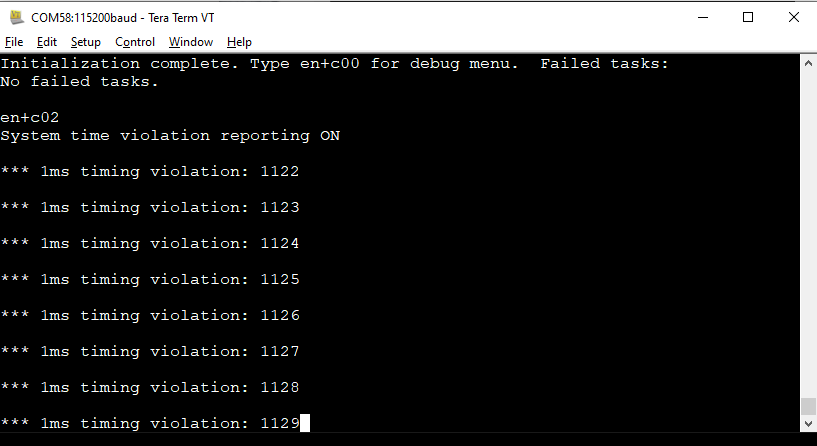
At this point, you can still type “en+c02” to toggle the warning message off, but you will likely not see the characters you are typing. Do it anyway. Then type “en+c00” and you should see the characters being typed and the menu printed again since the debug buffer has had time to clear itself out.
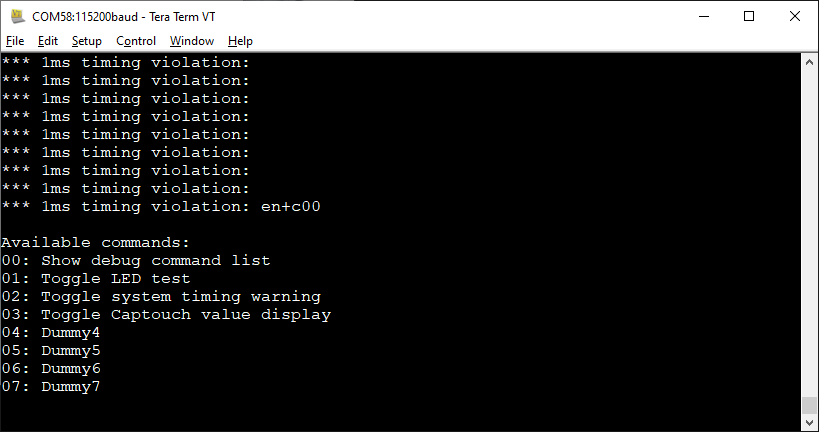
The use case for this functionality expects only occasional time faults to occur, so constant timing violations really break the system. Periodic timing errors are much more difficult to see happening which is where the en+c02 command is very helpful. For blatant timing violations that are occurring every system loop, it’s pretty obvious there is a problem because the rest of the system will show symptoms of an issue. For example, you might notice that the heartbeat LED is much brighter while all the error messages are being printed — this is because the system is much busier trying to send all the debug messages while at the same time being stuck in the UserApp2SMIdle() “for” loop.
Try changing the loop delay from 50,000 to 500,000. Notice what happens when the debug display is shown in the terminal and when you try to type “en+c02”
Once you have everything finished, comment out all the code you wrote so far using #if 0 and #endif around your code so it’s still there if you want to run it again (you can just change #if 0 to #if 1).
Exercise
To demonstrate all of the features of the Debug API, we will code a program that can read input values from the terminal. Comment out the code written so far so it no longer runs. Make sure you have the “extern” definitions copied in to user_app1.c that is discussed at the top of this module!
The following code should be written in UserApp1SM_Idle(). First, make BUTTON0 display the current number of characters in the scanf buffer (i.e. the value of G_u8DebugScanfCharCount). Set up some strings to be used to make the messages look good. Getting spaces, carriage returns and line feeds in the correct place tends to be the hardest part. As you saw with the 1ms error warning messages, there is a finite number of messages that can be queued to DebugPrintf(), so your application must allow some time for buffered messages to get processed by the Debug task.
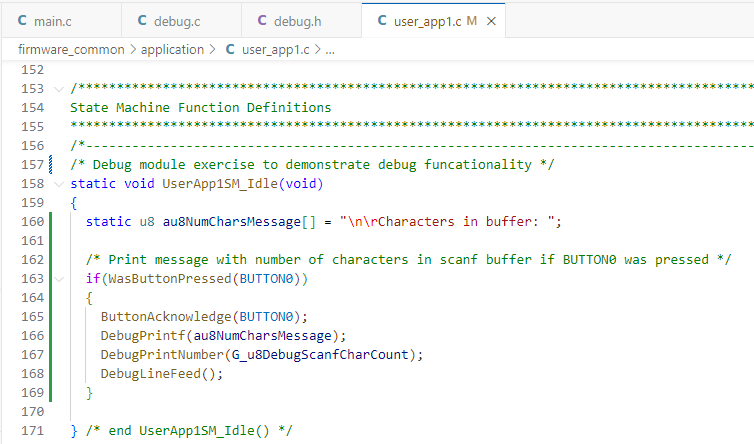
Build and test the code to make sure it works as expected. Pressing BUTTON0 when the code finishes booting should show “0”. Type some characters and press BUTTON0 again. You do not have to press Enter as you are typing characters — as soon as you type the character, the terminal will send it to the EiE dev board.

Now add BUTTON1 functionality that will read the input characters to a buffer in user_app1 and print the contents. Make this buffer global to user_app1.c and initialize it in User1AppInitialize(). The constant USER1_INPUT_BUFFER_SIZE is in user_app1.h and is specifically defined as the Debug scanf buffer size +1 to allow us to add a ‘\0’ at the end for use with DebugPrintf().
user_app1.h:

user_app1.c:
Declare the input buffer:

Initialize the buffer when the task starts to “NULL” which is the number 0 which is the ASCII character ‘\0’ (and since this is a character buffer, it’s nice to write the code with ASCII characters:
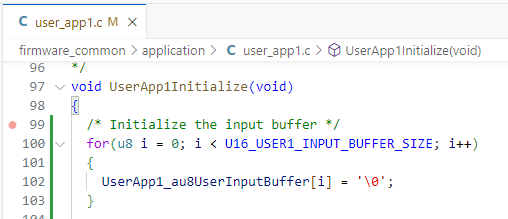
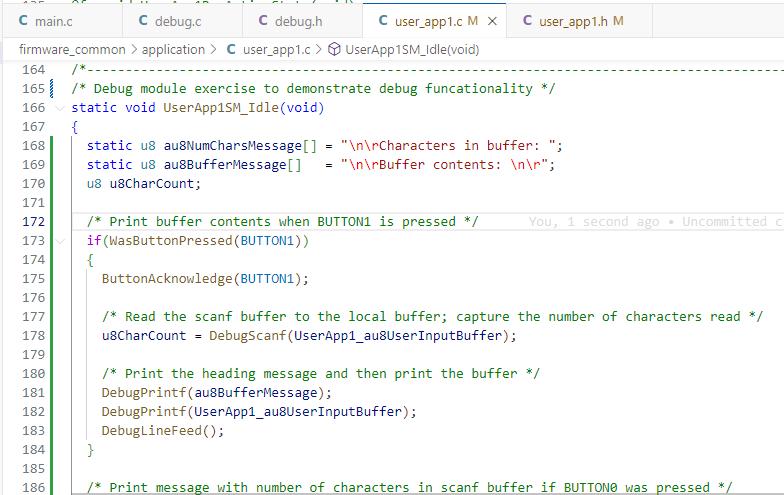
To reveal the error, follow the steps below exactly:
- Build and run the code.
- After you see the boot sequence complete, press BUTTON0 which should show there are no chars in the buffer.
- Type “BUTTON0 worked” but do not press the “Enter” key.
- Press BUTTON0: how many characters should be there? The output so far should look like this:
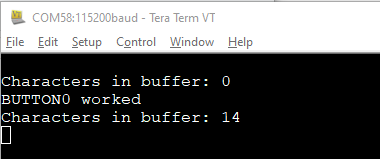
- Press BUTTON1 which should print out “Buffer contents: BUTTON0 worked” with a linefeed between the two and the cursor should be on a new line.
- Type “TEST” and then press BUTTON0 followed by BUTTON1. You should see this:
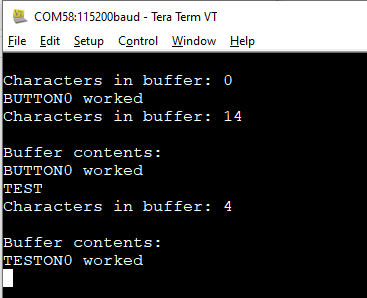
What happened? BUTTON0 correctly reported that 4 characters were in the scanf buffer, but BUTTON1 which sends the au8UserInputBfferto DebugPrintf() correctly shows “TEST” but also incorrectly shows remnants of the previous message. This is because DebugPrintf () requires a NULL-terminated character array (aka a “C-string”). If you repeated this exercise but pressed “Enter” after each string you typed, the code would work fine. It would be a very easy assumption that a user would press “Enter” after entering a line of text, but relying on assumptions is extremely poor practice. Firmware you write needs to be bullet-proof, which means every case must be handled.
The code below safely adds the NULL to terminate the string. “Safely” means to handle the edge case where the buffer is full.
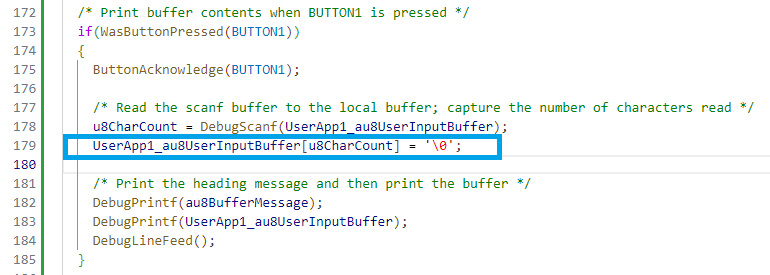
In this case, the “safety” has been provided by the definition for USER1_INPUT_BUFFER_SIZE which is the scanf buffer size plus 1, which means the buffer array will always have a memory location available at the end. If not, you would need to check for a full array and overwrite the last character with a “NULL” so you wouldn’t write to memory outside of UserApp1_au8UserInputBuffer[]. That would have disastrous results one day depending on what that memory location was being used for.
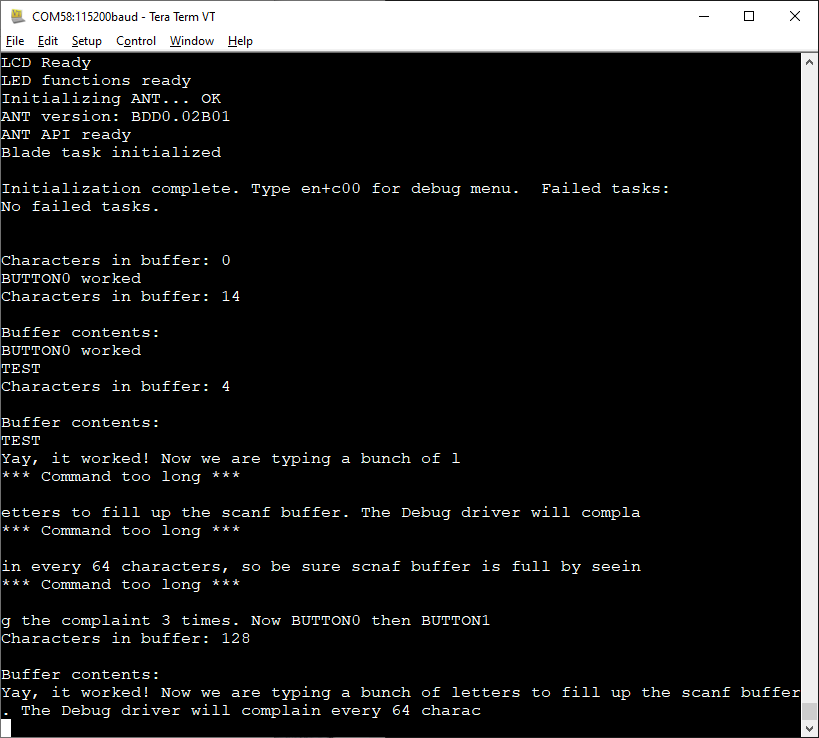
Repeat the test steps above to show that the error in reporting the “TEST” string is fixed. Then write a lot of characters to totally fill up the buffer to make sure it works with a full scanf buffer. The buffer needs to have 128 characters to be full. When you are trying to type that many characters, the debug driver will complain every 64 characters if the “Enter” key is not pressed because it is also watching the input stream into a different buffer meant for commands. Even though errors will be reported, the scanf buffer is filling up independently. The terminal sequence to check everything is shown below.
The various errors are explored to provide some very important lessons. First, always remember that an embedded system will do exactly what you tell it to do. On a bare metal system, this often includes letting you read or write any memory address you attempt.
Second, code can appear to work in many cases, but bugs can emerge once the program has run for a while and more things have happened. This kind of error is absolutely classic, yet continues to plague developers.
Third, test every condition and every edge case as soon as code is running, at some point after running for a while, and after long term operation. The latter is not necessarily possible since development time is finite. However, it is highly recommended to keep a production device after the product is released and keep using it to continue long term testing.
Finally, notice that the more code you add, the more potential problems you add. For a challenge, use the debugger to follow through the Debug driver code to see how it reads in characters. There is a lot going on that you never get to see by using the API. Experiment with input that includes spaces, backspaces, and the Enter key. Look how these show up in the input buffer.
Module Exercise
Part 1: Write code to detect every time your name is typed on the input and count how many times it’s typed. You do not need to press enter – just monitor the input buffer. Make sure the code works when you repeat letters in your name. You can disable the other task that monitors user input by calling the DebugSetPassthrough() API function when your task initializes.
Part 2: Each time your name is detected, print the current name count surrounded by a box of ‘*’ characters. Ensure the box changes size with the number of digits. Use BUTTON3 to multiply the current name count by 10 so that you can easily test all of the digits.
[STATUS: RELEASED. LAST UPDATE: 2024-NOV-12]

